Experiments
To validate our work, we replicated and extended a previously published evaluation study of aberration detection methods. This entailed a) representing the algorithms and the evaluation process in our model; b) configuring, deploying and running the evaluation study in the BioSTORM software; and c) comparing our results to those reported by the authors of the original study.
We chose to replicate and extend a study by Hutwagner and colleagues, who compared three non-historical algorithms from the CDC’s Early Aberration Reporting System (EARS): C1, C2 and C3. The original study used simulated data to estimate the sensitivity, specificity, and time to detection for the C algorithms. In our validation study, we used the same simulated surveillance data and followed the same evaluation steps as in the original study. The important change in our study was that, for selected data sets, we computed a receiver operating characteristics (ROC) curve for each algorithm by systematically varying the value of the alerting threshold.
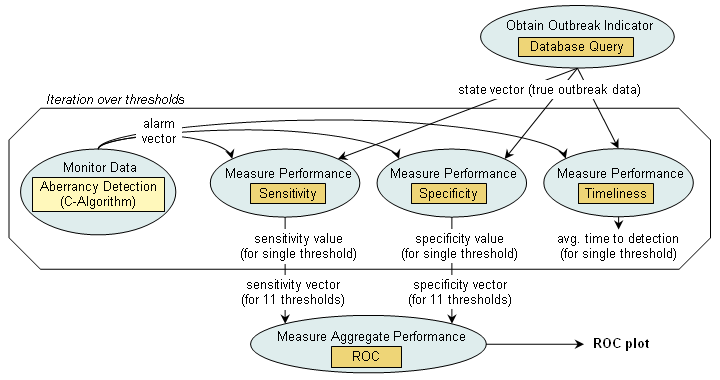
Within our modeling approach, all three algorithms are identical in terms of their task decomposition due to their structural similarity. The figure below schematically depicts the configuration of the evaluation analysis that we performed using BioSTORM to replicate the CDC study (click on an image for details).
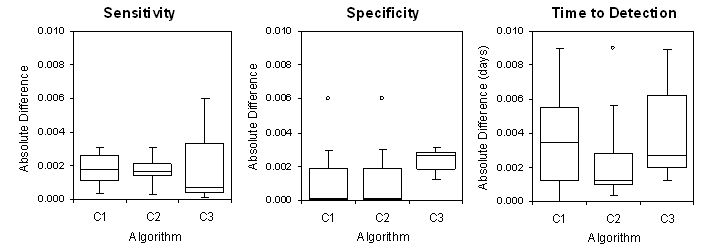
The comparison of our results to those obtained in the original study are presented in the figure below. The absolute differences do not exceed 0.006 for sensitivity and specificity and 0.01 days for time to detection. These deviations are due to rounding errors and minor differences in implementation of the algorithms by CDC and by our group.
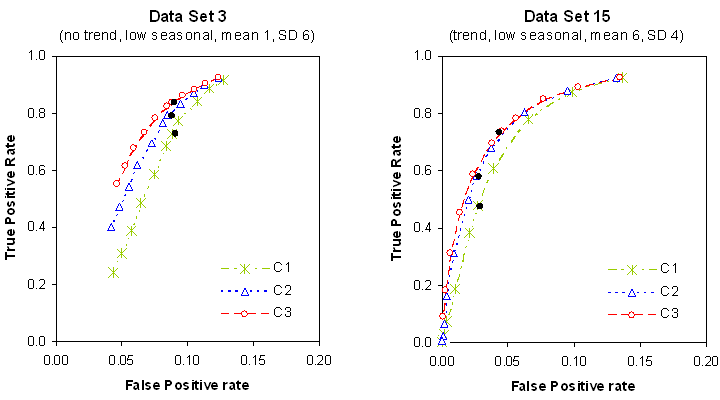
The next figure presents the ROC curves obtained in an extended analysis using 11 threshold values for two data sets. The points corresponding to the originally reported results for each of the algorithms are added to the plots (displayed as bold dots), which demonstrates the close match with the corresponding results we have obtained in our replication study.


