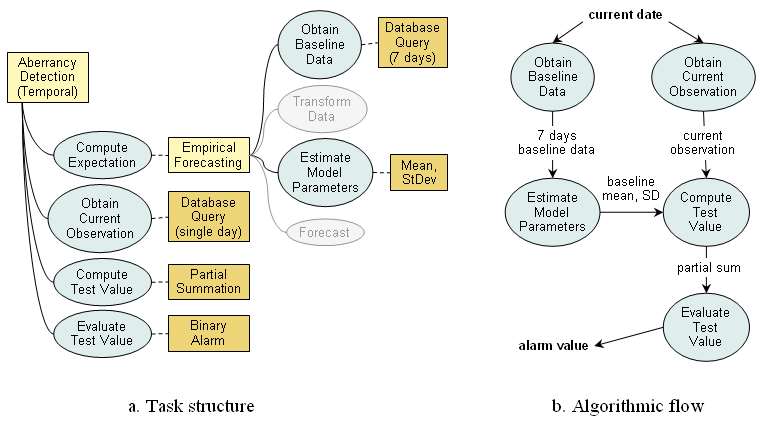
Representation of EARS C-family algorithms

The C-algorithms compute expected values by analyzing a sliding period of historical data, which is characteristic of an Empirical Forecasting method. This method decomposes the Compute Expectation task into several subtasks. First, seven consecutive observations from the recent history are retrieved to serve as baseline data. For C1, these are observations immediately preceding the current observation; C2 and C3 use baseline data separated from the current observation by two days. This difference can be encoded by manipulating the value of a configuration property of the Database Query method used to perform Obtain Baseline Data task, and such manipulation does not change the overall task structure, method selection, or procedural flow. The Estimate Model Parameters task for the C-algorithms entails computing a seven-day mean and standard deviation. None of the C-algorithms performs any data transformation, such as outlier removal, so the Transform Data task is not executed. The same is true for the Forecast task, since the baseline mean computed by a previous task is used directly as the expected value. The Obtain Current Observation task retrieves a single observation from the current test period.
C-algorithms are defined as variants of single-sided cumulative summation, which implies that the current observation is replaced with the value of a cumulative sum by the Compute Test Value task. However, the computation of a test statistic for these algorithms is different from traditional cumulative summation: C1 and C2 use only the current observation, which makes them more similar to Shewhart charts than to a true CUSUM; the C3 algorithm sums two previous observations and the current one. A true cumulative sum, on the other hand, can be influenced by an infinite number of prior observations. To reflect this important distinction and to avoid confusion, we have labeled the method for computing a test statistic in C-family algorithms as Partial Summation and supplied it with a configuration property (depth-of-memory) to specify how many values are taken into account.
Finally, a primitive Binary Alarm method is used to make an alerting decision in the Evaluate Test Value task. This method compares the previously computed detection statistic (partial sum) to the value of the alerting threshold, specified as the number of standard deviations above the expected mean.
Figure b shows a data-flow diagram representing how subtasks of aberrancy detection using C-algorithms are interconnected. As adaptive algorithms, C1, C2 and C3 repeat all the steps listed above at each observation period. The figure displays flow within a single step of execution and does not reflect the adaptive nature of the algorithms. To represent step repetition in C-algorithms, we place all five tasks into an iteration container, a control structure responsible for supplying dynamically changing data and configuration information to the enclosed tasks and their methods. In this particular case, current date, which is needed by data query methods of both the Obtain Current Observation and the Obtain Baseline Data tasks, must change at each execution step.
← Back to Models