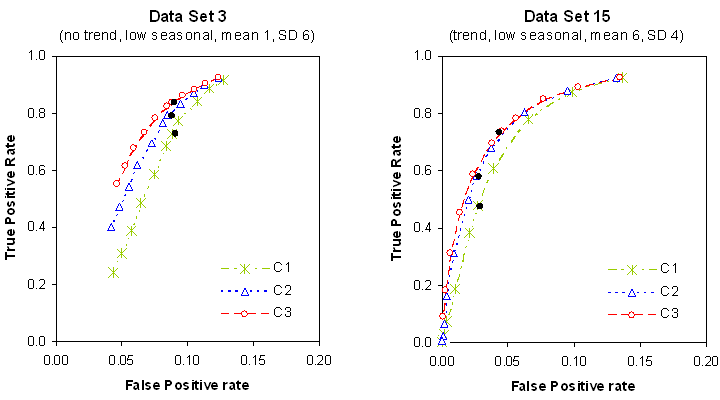
Results of the extended analysis
The ROC curves were obtained in an extended analysis using 11 threshold values. The points corresponding to the results reported in the original CDC study for each of the algorithms are added to the plots as bold dots.
← Back to Experiments
Except where otherwise noted, content on this wiki is licensed under the following license: CC Attribution-Noncommercial-Share Alike 4.0 International
